Average Latency Feedback
Overview
Degradation in response latency can serve as a reliable signal for identifying service overload. This policy is designed to detect overload situations based on latency deterioration. During overload, the request rate is throttled so that latency gets restored back to an acceptable range.
Configuration
This policy is based on the
Load Scheduling with Average Latency Feedback
blueprint. The latency of requests processed by the
cart-service.prod.svc.cluster.local service is monitored. By analyzing the
variance between current latency and a historical latency baseline, the policy
facilitates the identification of potential service overload. A deviation of
1.1 from the baseline is considered as a signal of service overload.
In addition, workload prioritization is specified in the load scheduler based on user types accessing the service. User types are identified based on the value of a header label http.request.header.user_type. Requests matching label value guest are assigned a priority of 50, whereas those matching subscriber are given a priority of 200.
To mitigate service overload, the requests to the
cart-service.prod.svc.cluster.local service are passed through a load
scheduler. The load scheduler reduces the request rate in overload scenarios,
temporarily placing excess requests in a queue.
As service latency improves, indicating a return to normal operational state, the request rate is incrementally increased until it matches the incoming request rate. This responsive mechanism helps ensure that service performance is optimized while mitigating the risk of service disruptions due to overload.
The below values.yaml file can be generated by following the steps in the
Installation section.
- aperturectl values.yaml
# yaml-language-server: $schema=../../../../../../blueprints/load-scheduling/average-latency/gen/definitions.json
# Generated values file for load-scheduling/average-latency blueprint
# Documentation/Reference for objects and parameters can be found at:
# https://docs.fluxninja.com/reference/blueprints/load-scheduling/average-latency

blueprint: load-scheduling/average-latency
uri: ../../../../../../../blueprints
policy:
  # Name of the policy.
  # Type: string
  # Required: True
  policy_name: workload-prioritization
  # List of additional circuit components.
  # Type: []aperture.spec.v1.Component
  components: []
  load_scheduling_core:
    aimd_load_scheduler:
      gradient:
        max_gradient: 1
        min_gradient: 0.1
        slope: -1
      alerter:
        alert_name: AIMD Load Throttling Event
      load_multiplier_linear_increment: 0.025
      max_load_multiplier: 2
      load_scheduler:
        # The selectors determine the flows that are protected by this policy.
        # Type: []aperture.spec.v1.Selector
        # Required: True
        selectors:
          - control_point: ingress
            service: cart-service.prod.svc.cluster.local
        # Scheduler parameters.
        # Type: aperture.spec.v1.SchedulerParameters
        scheduler:
          workloads:
            - label_matcher:
                match_labels:
                  http.request.header.user_type: guest
              parameters:
                priority: 50.0
            - label_matcher:
                match_labels:
                  http.request.header.user_type: subscriber
              parameters:
                priority: 200.0
  latency_baseliner:
    # Tolerance factor beyond which the service is considered to be in overloaded state. E.g. if the long-term average of latency is L and if the tolerance is T, then the service is considered to be in an overloaded state if the short-term average of latency is more than L*T.
    # Type: float64
    latency_tolerance_multiplier: 1.1
    # Flux Meter defines the scope of latency measurements.
    # Type: aperture.spec.v1.FluxMeter
    # Required: True
    flux_meter:
      selectors:
        - control_point: ingress
          service: cart-service.prod.svc.cluster.local
Generated Policy
Circuit Diagram for this policy.
Installation
Generate a values file specific to the policy. This can be achieved using the command provided below.
aperturectl blueprints values --name=load-scheduling/average-latency --version=main --output-file=values.yaml
Apply the policy using the aperturectl CLI or kubectl.
- aperturectl (Aperture Cloud)
- aperturectl (self-hosted controller)
- kubectl (self-hosted controller)
aperturectl cloud blueprints apply --values-file=values.yaml
Pass the --kube flag with aperturectl to directly apply the generated policy
on a Kubernetes cluster in the namespace where the Aperture Controller is
installed.
aperturectl blueprints generate --values-file=values.yaml --output-dir=policy-gen
aperturectl apply policy --file=policy-gen/policies/workload-prioritization.yaml --kube
Apply the generated policy YAML (Kubernetes Custom Resource) with kubectl.
aperturectl blueprints generate --values-file=values.yaml --output-dir=policy-gen
kubectl apply -f policy-gen/policies/workload-prioritization-cr.yaml -n aperture-controller
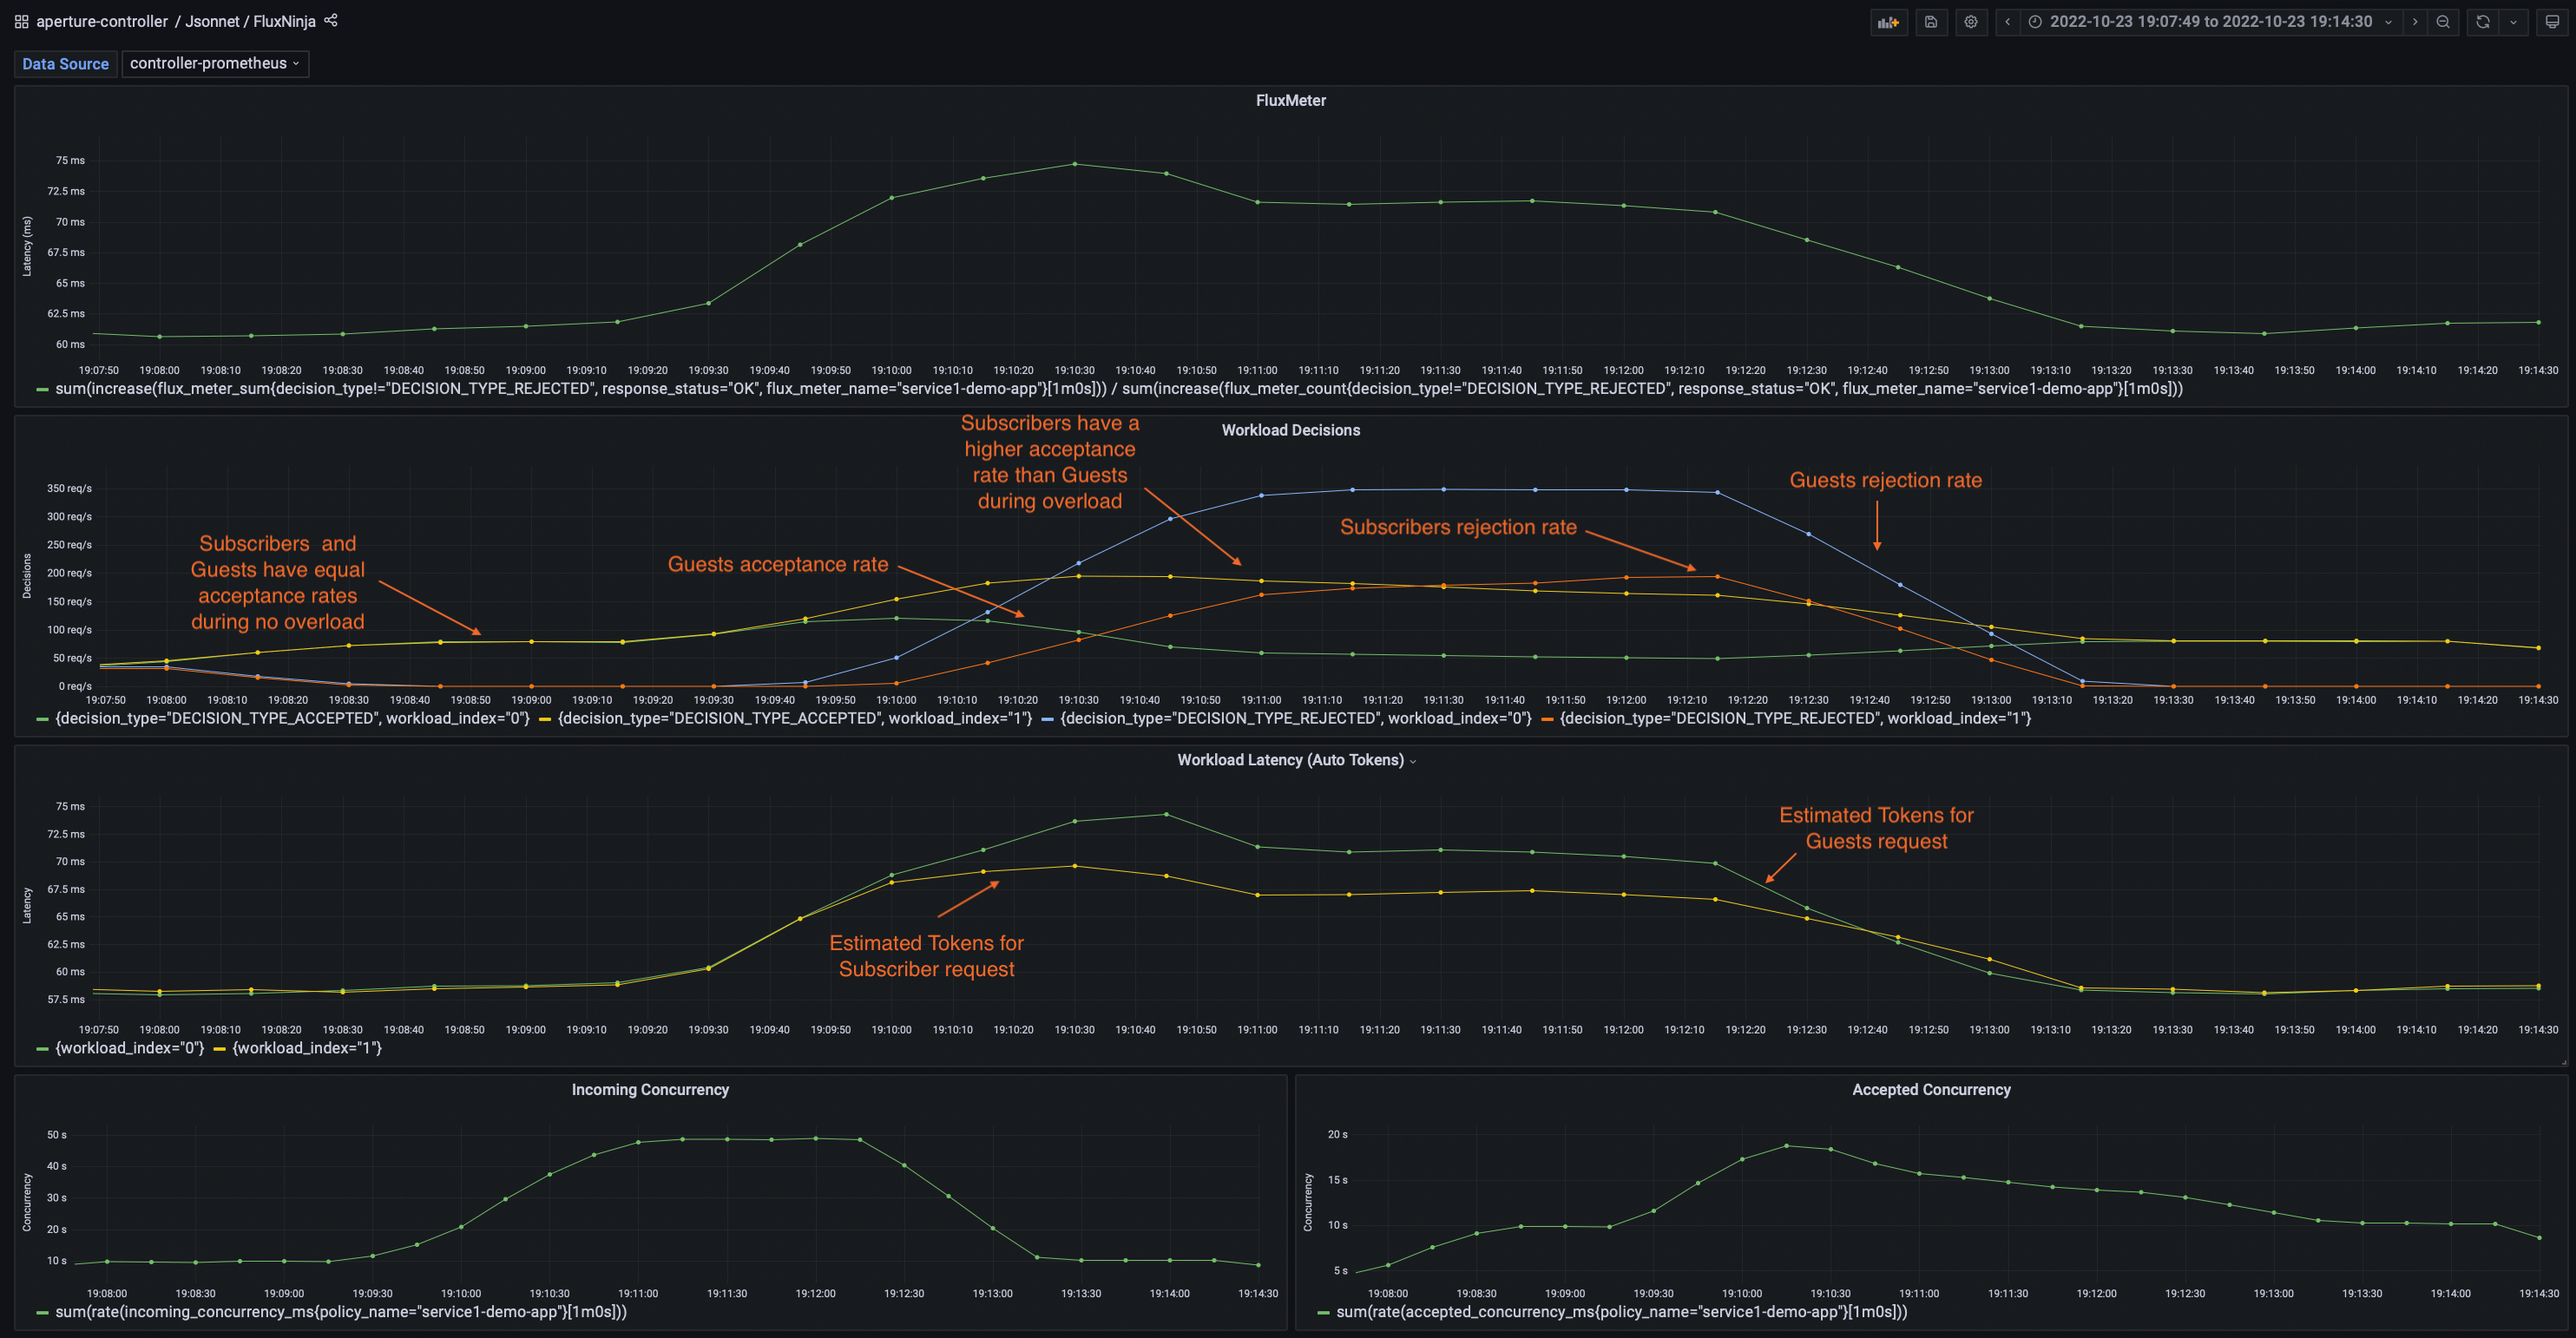
Policy in Action
To see the policy in action, the traffic is generated such that it starts within
the service's capacity and then goes beyond the capacity after some time. Such a
traffic pattern is repeated periodically. The below dashboard demonstrates that
when latency spikes due to high traffic at
cart-service.prod.svc.cluster.local, the Controller throttles the rate of
requests admitted into the service. This approach helps protect the service from
becoming unresponsive and maintains the current latency within the tolerance
limit (1.1) of historical latency.
Dry Run Mode
You can run this policy in the Dry Run mode by setting the
policy.load_scheduling_core.dry_run parameter to true. In the Dry Run
mode, the policy does not throttle the request rate while still evaluating the
decisions it would take in each cycle. This is useful for evaluating the policy
without impacting the service.
The Dry Run mode can also be toggled dynamically at runtime, without reloading
the policy.
Demo Video
The below demo video shows the basic service protection and workload prioritization policy in action within Aperture Playground.