
Even thirty years since its inception, PostgreSQL continues to gain traction, thriving in an environment of rapidly evolving open source projects. While some technologies appear and vanish swiftly, others, like the PostgreSQL database, prove their longevity, illustrating that they can withstand the test of time. It has become the preferred choice by many organizations for data storage, from general data storage to an asteroid tracking database. Companies are running PostgreSQL clusters with petabytes of data.
Operating PostgreSQL on a large scale in a production environment can be challenging. Companies have experienced downtime and performance problems, resulting in financial losses and diminished trust, especially if the outages extend beyond a few hours. A case in point is the GitLab database outage in Jan 2017. Though there were many attributes to how this outage happened, but to emphasize how overload can play a significant role, in their timeline, they explained how much time it took to control overload happening at that time, which cost them hours to control it.
± 19:00 UTC: GitLab.com starts experiencing an increase in database load due to what we suspect was spam. In the week leading up to this event, GitLab.com had been experiencing similar problems, but not this severe. One of the problems this load caused was that many users were not able to post comments on issues and merge requests. Getting the load under control took several hours.
In their analysis of why GitLab was down for 18 hours, they cited one of the reasons as:
Database load increase - Which is caused by two events happening at the same time: an increase in spam and a process trying to remove a GitLab employee and their associated data.
These outages and performance issues could have been avoided with proper database protection in place. In this blog, we will explore the common issues faced by PostgreSQL, discuss what PostgreSQL protection entails, and delve into how FluxNinja has achieved it using Aperture.
PostgreSQL and Microservices
PostgreSQL is a relational database that forms the backbone of many microservices-based applications. However, careful management of its performance and an understanding of its behaviors with respect to related services are vital to maintaining the system's stability and resilience.
Most microservices-based applications today employ caching mechanisms to reduce the load on the database. The request hits the database only when the data is not found in the cache. Under normal operations, this enables efficiency and performance.
However, this efficient harmony can be disrupted when the database experiences a slowdown or overload. Along similar lines, in the past, HoneyComb.io experienced a partial API outage because of it.
When database performance faltered, cache entries began to expire at an
increased rate. This, in turn, triggered a significant surge in goroutines
attempting to refresh the cache simultaneously, which resulted in a
resource-draining feedback loop that created system-wide strain. The outcome was
a 'fire' that spread across the various microservices.
From this incident, these were the essential findings,
- Caching is A Double-Edged Sword
- It’s better to know the Cache Refresh Behavior, i.e., limiting the number of concurrent cache refresh operations can prevent feedback loops and keep the system stable even during periods of increased load on the database.
- Setup Proactive Alerting and Observability for the Database - By identifying potential issues early, swift corrective measures can be implemented, preventing minor issues from snowballing into major system disruptions.
Let's examine how PostgreSQL performs in a multi-tenant setup; A multi-tenant architecture encapsulates distinct tenants, analogous to separate users or applications, within a shared PostgreSQL database cluster. While operating in isolation at the application level, each tenant contends for the same system resources - CPU cycles, memory, disk I/O - at the database level. The challenge here is performance isolation: ensuring that the resource-intensive operations of one tenant don't impede the performance experienced by others.
In high-load scenarios or during concurrent execution of expensive queries, tenants can monopolize shared resources, causing significant performance degradation for others. Managing concurrency becomes a complex task, requiring careful allocation of shared resources to maintain system performance. For more information on similar issues, you can look into the challenges Cloudflare has faced. However, such issues could be solved by PostgreSQL protection and quota per tenant.
We will explore more about what PostgreSQL Protection is, in the next sections. Before that, let’s understand the common PostgreSQL issues that generally degrade performance.
Common PostgreSQL Issues
- Maxed-out Connections: Exceeding the maximum allowed connections can result in performance lags. Too many simultaneous client connections often cause this. Connection pooling can help, but connection exhaustion may still occur.
- Spikes in Memory & CPU Usage: Several factors can contribute to high
memory and CPU usage:
- Large or complex queries.
- A high number of simultaneous connections.
- Resource-intensive background processes.
- Multiple services refreshing their cache at the same time.
- High Response Latency: High CPU usage can delay PostgreSQL's response time, affecting service reliability and user experience. This latency, when combined with CPU spikes, could result in system failures and dropped connections.
- Poorly Optimized Queries: These can monopolize the connection, leading to connection starvation. One poorly optimized query is enough to cause a bottleneck, and multiple such queries can exacerbate the problem. The GitHub outage in May 2023 and the SemaphoreCI outage are examples of the impact of inefficient queries.
- Corrupted Index: This can lead to inaccurate query results or slow down data retrieval. It can also trigger unnecessary full table scans, straining CPU and memory resources.
- The Noisy Neighbor Problem: In multi-tenant PostgreSQL setups, this issue arises when one tenant's high resource usage affects others' performance. Techniques like manual concurrency limiting and load shedding can help manage this. The Cloudflare case is an example of successfully handling this issue.
The performance issues we've discussed are common with PostgreSQL, and various strategies and tools can help tackle them. One such effective tool is Aperture. Now, let's explore how FluxNinja employed Aperture to navigate these PostgreSQL challenges successfully.
Aperture Cloud's Battle with PostgreSQL
Aperture Cloud is a cloud-based solution designed by FluxNinja that enhances the functionality of the Aperture platform. It provides an intuitive interface that simplifies the management of Aperture systems operating across various clusters.
Aperture Cloud, the interface for Aperture, offers key features including a user-friendly interface, flow analytics for traffic insights, an alerting system, visualization tools, and a streamlined policy builder UI. Aperture itself is an advanced load management platform emphasizing observability, with features like Adaptive Service Protection, Intelligent Quota Management, Workload Prioritization, and Load-Based Auto Scaling.
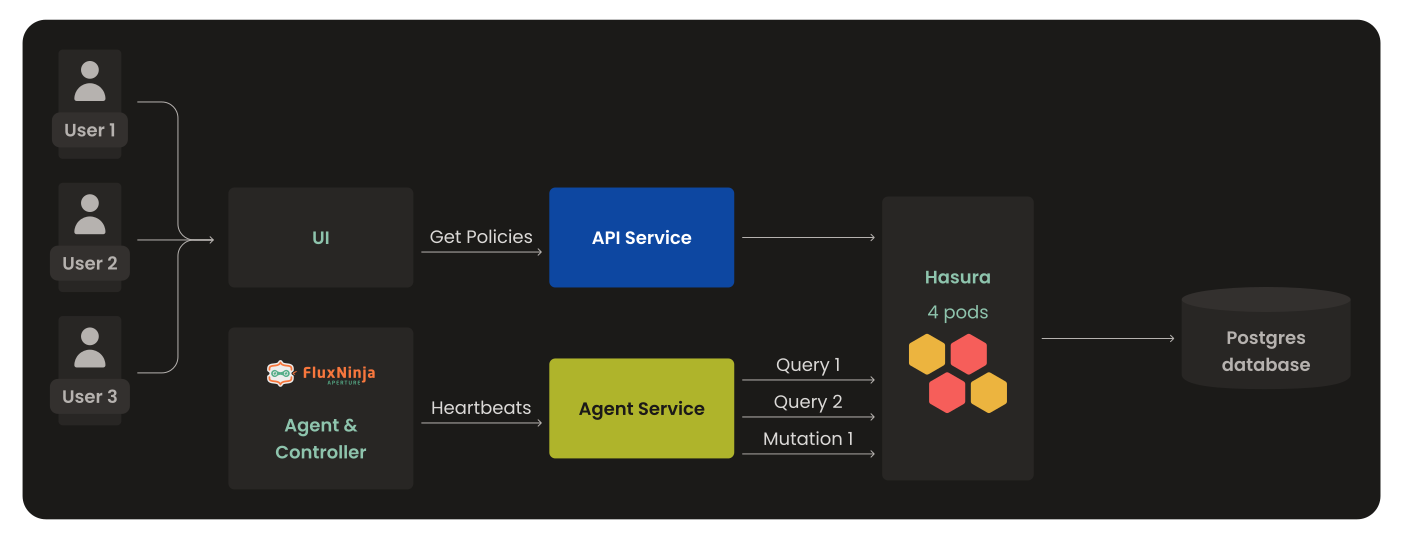
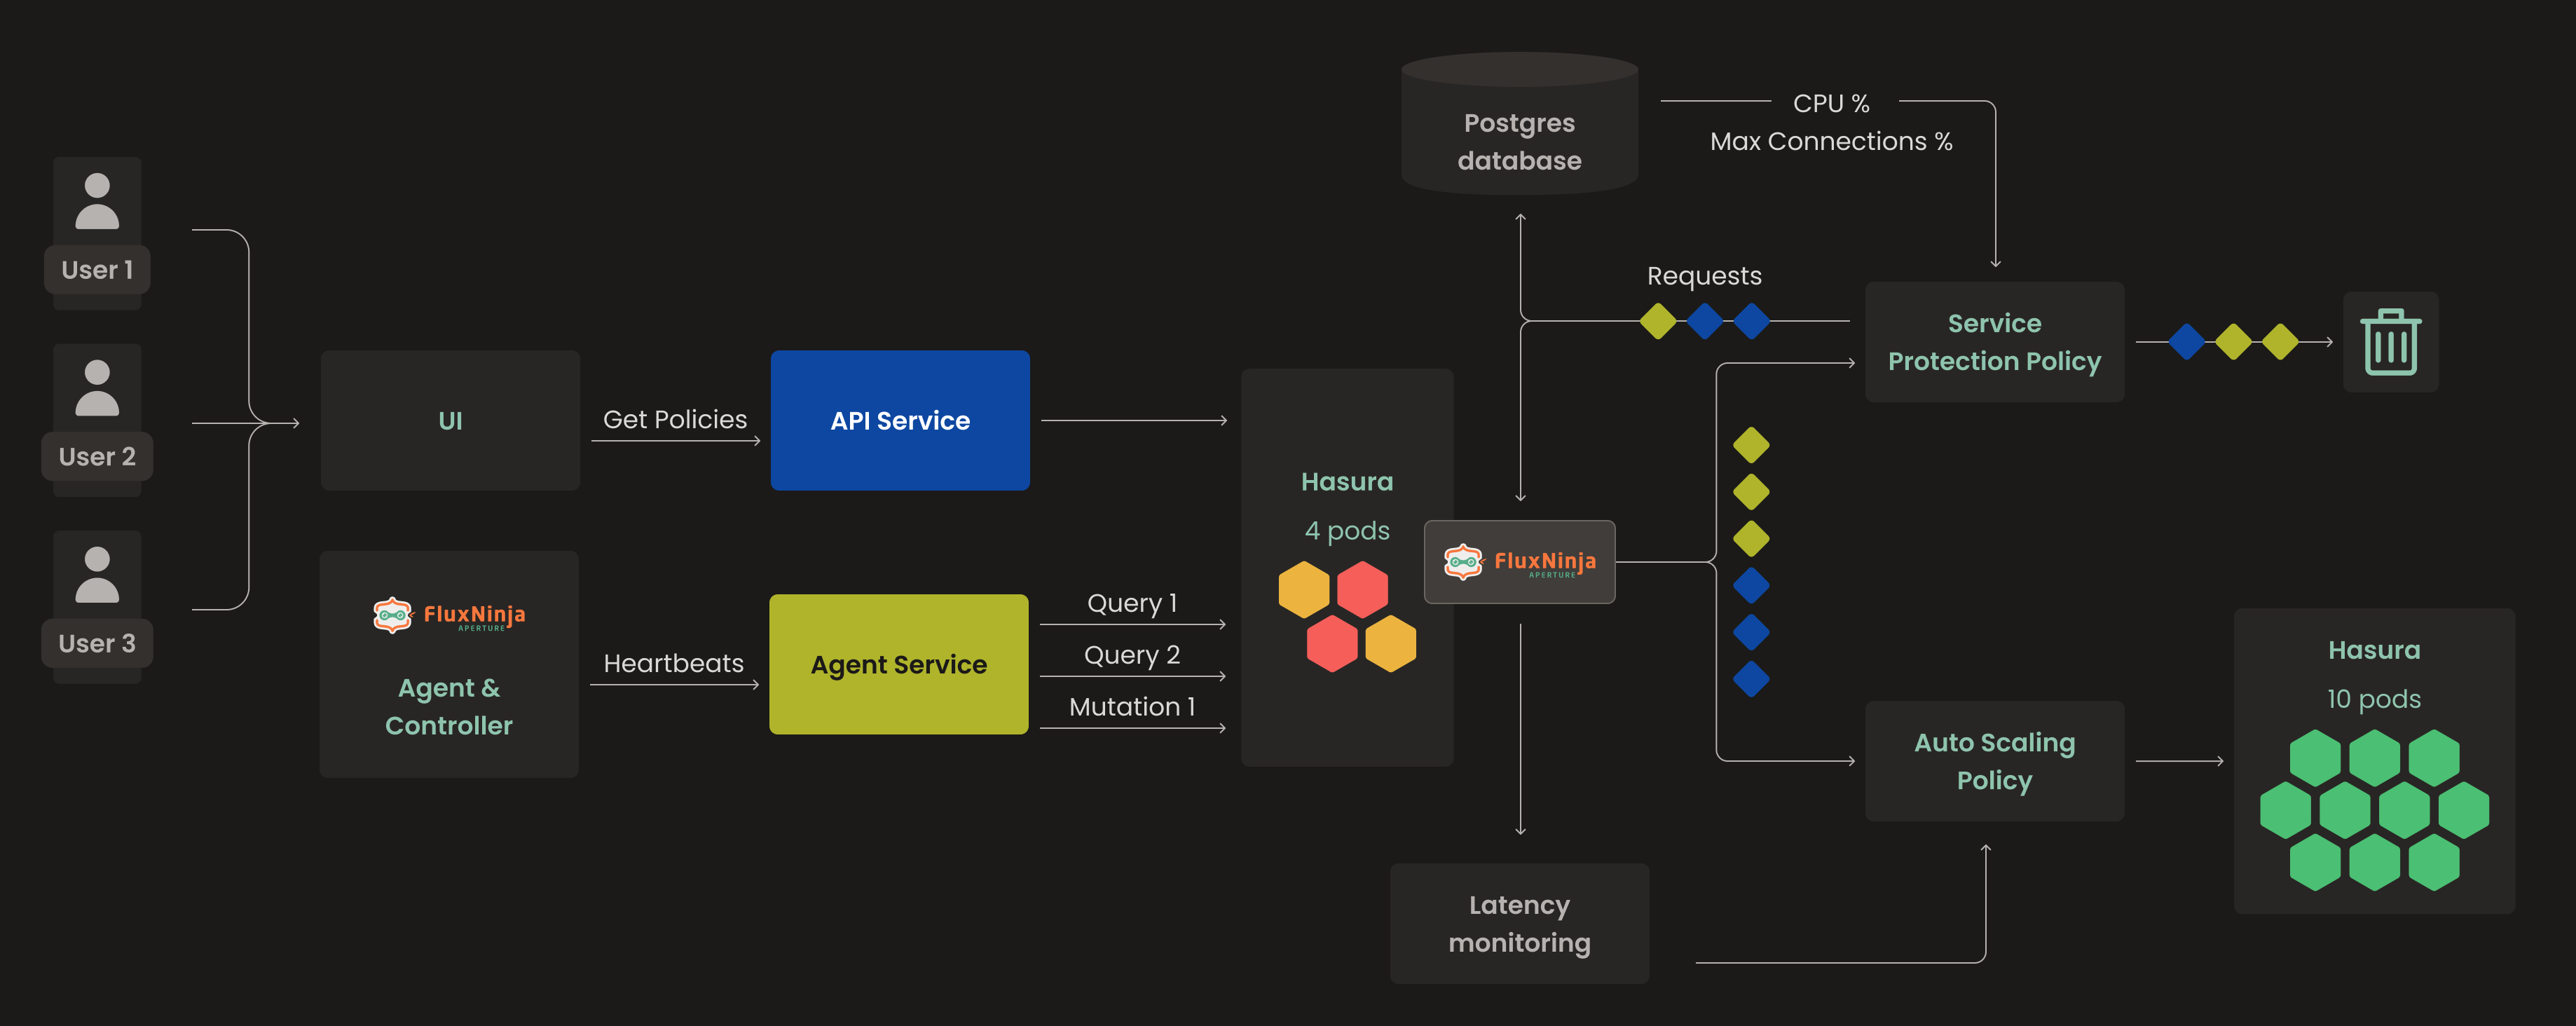
Let's concentrate specifically on services that engage with PostgreSQL, rather than delving into the broad scope of the entire cloud architecture.
Aperture Cloud has two services, API Service and Agent Service. API services that deal with UI, Organization, Sign in and Sign up, and similar functionality. The agent service collects heartbeats & last sync status from the agents & controllers running on different clusters. It also collects details of policies attached to controllers. However, both services don't directly interact with PostgreSQL, instead Hasura mediates the connection between both. The presence of Hasura between PostgreSQL and services brings significant benefits, as it offloads various tasks such as observability, authorization, and simplification of the SQL workflow. That being said, let’s jump into the problems we encountered with PostgreSQL & Hasura.
While investigating the issue of performance, we observed that there were too many requests from both the API and Agent services. This resulted in
- Surge in requests and increased latency, leading to poor user experience
- While Hasura serves as a GraphQL engine, there are instances where it can become a performance bottleneck, struggling to handle the sudden influx of requests and failing to cope with the volume of incoming traffic.
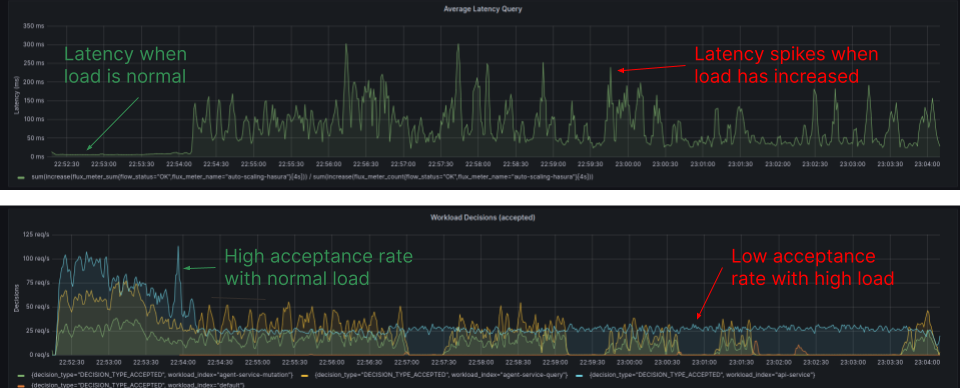
The Diagram, sourced from the Grafana Dashboard, illustrates the latency and workload acceptance rate for individual workloads. Latency spikes surpass 250ms, and the acceptance rate decreases under high load conditions.
To address these issues, we considered two solutions:
- Scaling:
- Scaling could remove Hasura acting as a bottleneck.
- If we scale too much to handle more requests, we could end up putting too much stress on PostgreSQL. Sending the same heavy load directly to PostgreSQL, potentially overloading it.
- Rate Limiting:
- To prevent PostgreSQL from being overwhelmed, we could limit the rate of incoming requests.
- This approach has a downside: It will penalize all the requests coming towards PostgreSQL without the context of workload priorities. It doesn't differentiate between high and low-priority workloads.
- This means:
- Low-priority requests can interfere with high-priority ones.
- If low-priority requests are more numerous, high-priority workloads could get delayed. Therefore, high-priority tasks could be penalized more frequently.
This concept of workload prioritization can be envisaged within a multi-tenant environment, where each service behaves akin to a tenant, and one tenant may have higher priority than another, analogous to one service over another. For instance, we wouldn't want the API service to be starved of request resources of PostgreSQL due to the agent service.
API service requests should’ve priority over Agent Service to deliver the best user experience to the Individuals who are using the cloud product.
The Solution: Aperture PostgreSQL Protection
The challenge at hand was to devise a strategy that would prioritize workloads, mitigate the risk of overloading PostgreSQL, prevent Hasura from becoming a bottleneck, and keep the user experience consistent.
Aperture appears to be the ideal solution for addressing these challenges, and several compelling reasons reinforce our belief in its suitability.
- Aperture can do concurrency throttling if required.
- It is built around a similar idea of Congestion Avoidance; Rather than reactively shedding the load, congestion avoidance “smoothly” throttles traffic before load-induced performance degradation becomes an issue.
- For a Multi-tenant environment, we can ensure resource consumption and detect tenants who are exceeding quotas and do query throttling with the help of quota management.
All of this is possible because of Adaptive Load Scheduling.
What is Aperture Adaptive Load Scheduling (ALS)?
ALS is designed to safeguard services by dynamically adjusting the request rates. It does this by analyzing various health signals like latency and error rates, along with metrics like JMX and DB connections.
It also enables Workload Prioritization. Requests are classified and labeled through declarative rules, enabling the scheduler to identify the criticality of different tasks. Algorithms such as the token bucket and weighted-fair queuing are employed to prioritize crucial requests over background workloads, ensuring system stability and efficient resource utilization.
Inspired by PID controllers, Aperture is a closed-loop system leveraging algorithms such as TCP BBR, AIMD, and CoDel. It seamlessly interacts with auto-scaling and load balancing systems to ensure optimal performance.
Aperture Policies
Aperture is powered by policies. It is what defines a control circuit graph.
A policy in Aperture is a way to programmatically define conditions and actions
that the system should follow to maintain its stability. These policies are
evaluated regularly, and if any deviations from desired behavior are detected,
appropriate actions are taken to correct them. Think of it as a system's
rulebook that helps it make decisions and keep things running smoothly. Learn
more about policies on official
documentation.
Hasura Auto Scale Policy
To remove Hasura from the picture of bottleneck, it’s important to scale it as
the load increases. It becomes easy to do it via
Service Protection with Average Latency Feedback
Blueprint in addition to the Auto Scale component. The reason behind using this
policy is it detects traffic overloads and cascading failure build-up by
comparing the real-time latency with its exponential moving average. Which can
act as an accurate signal to actuate, that is when to do Auto Scale. The policy
is defined with a latency baseliner configured with a label matcher on source
and operation type requests. This means if the latency deviates from EMA, then
it will try to send a signal for overload, which auto scale will act on.
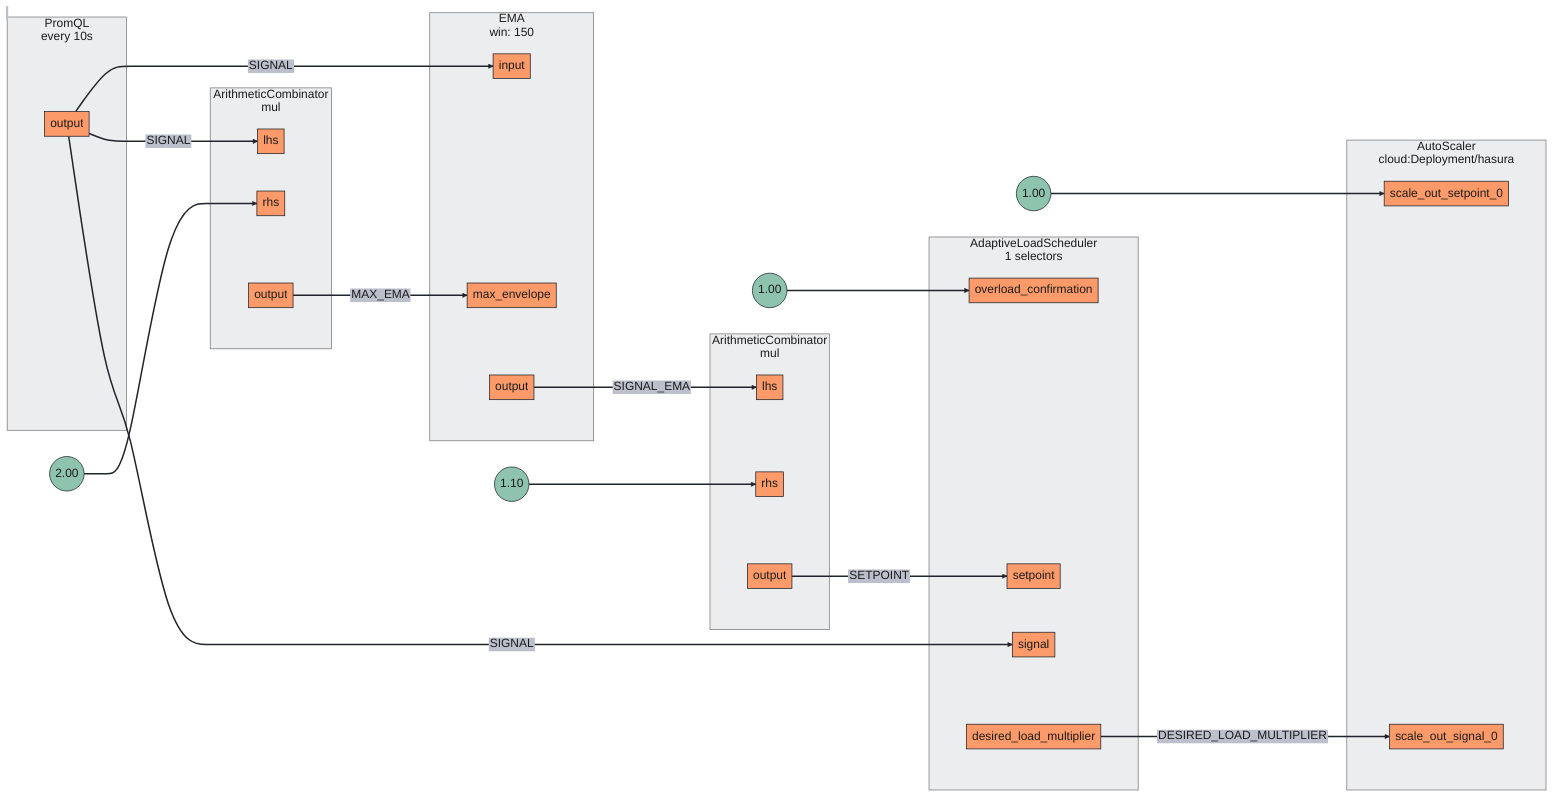
Below is the Circuit diagram of the policy; based on the circuit, it’s easier to pass on the signal values to the Auto Scale component from the Adaptive Load Scheduler component for auto-scaling decisions. While the Service Protection circuit is helping us get all the metrics and signals required. Another way to do it is via PromQL based Service Protection, but Average Latency Feedback seemed more relevant for the current case.
During overload and sudden spikes, Aperture detects the latency deviation from the EMA, which will act as a signal (Desired Load Multiplier) to scale until it returns to the state where it should be.
Hasura Auto Scale Policy
# yaml-language-server: $schema=../../../../../../aperture/blueprints/policies/service-protection/average-latency/gen/definitions.json
policy:
  policy_name: auto-scaling-hasura
  components:
    - auto_scale:
        auto_scaler:
          dry_run: false
          dry_run_config_key: dry_run
          scale_in_controllers:
            - alerter:
                alert_name: Periodic scale in intended
              controller:
                periodic:
                  period: 60s
                  scale_in_percentage: 10
          scale_out_controllers:
            - alerter:
                alert_name: Load based scale out intended
              controller:
                gradient:
                  in_ports:
                    setpoint:
                      constant_signal:
                        value: 1
                    signal:
                      signal_name: DESIRED_LOAD_MULTIPLIER
                  parameters:
                    slope: -1
          scaling_backend:
            kubernetes_replicas:
              kubernetes_object_selector:
                agent_group: default
                api_version: apps/v1
                kind: Deployment
                name: hasura
                namespace: cloud
              max_replicas: "10"
              min_replicas: "1"
          scaling_parameters:
            scale_in_alerter:
              alert_name: Hasura auto scaler is scaling in
            scale_in_cooldown: 40s
            scale_out_alerter:
              alert_name: Hasura auto scaler is scaling out
            scale_out_cooldown: 30s
  resources:
    flow_control:
      classifiers:
        - selectors:
            - service: hasura.cloud.svc.cluster.local
              control_point: ingress
          rego:
            labels:
              source:
                telemetry: true
              operation:
                telemetry: true
            module: |
              package hasura_example
              source = input.attributes.source.source_fqdns[0]
              operation = graphql.parse_query(input.parsed_body.query).Operations[_].Operation
  service_protection_core:
    dry_run: true
    adaptive_load_scheduler:
      load_scheduler:
        selectors:
          - control_point: ingress
            service: hasura.cloud.svc.cluster.local
        scheduler:
          workloads:
            - label_matcher:
                match_labels:
                  source: "api-service.cloud.svc.cluster.local"
              parameters:
                priority: "250"
              name: "api-service"
            - label_matcher:
                match_labels:
                  source: "agent-service.cloud.svc.cluster.local"
                  operation: "mutation"
              parameters:
                priority: "100"
              name: "agent-service-mutation"
            - label_matcher:
                match_labels:
                  source: "agent-service.cloud.svc.cluster.local"
                  operation: "query"
              parameters:
                priority: "50"
              name: "agent-service-query"
  latency_baseliner:
    latency_tolerance_multiplier: 1.1
    flux_meter:
      selectors:
        - control_point: ingress
          service: hasura.cloud.svc.cluster.local
          label_matcher:
            match_labels:
              operation: "query"
              source: "api-service.cloud.svc.cluster.local"
PostgreSQL Service Protection Policy
To shield the PostgreSQL from overload and sudden spikes, we created a PostgreSQL Protection Blueprint. Blueprints already do the heavy lifting with pre-configured InfraMeters for telemetry collection. InfraMeters provide a way to define metric collection pipelines in the OpenTelemetry Collector embedded within Aperture. Read more about Feeding custom metrics in Aperture.
The blueprint revolves around two critical metrics:
- Max Connections on PostgreSQL:
- PromQL Query:
(sum(postgresql_backends) / sum(postgresql_connection_max)) * 100 - This query computes the percentage of maximum connections currently in use by PostgreSQL, providing real-time insight into the connection load.
- PromQL Query:
- CPU overload confirmation:
- PromQL Query:
avg(k8s_pod_cpu_utilization_ratio{k8s_statefulset_name="hasura-postgresql"}) - This query is employed to track the CPU utilization of the PostgreSQL
service, housed within a Kubernetes
statefulSetnamedhasura-postgresql. When a potential CPU overload is detected, this metric serves as a signal to activate the Adaptive Load Scheduler.
- PromQL Query:
These queries could be rewritten according to the problem requirement; for
example, if you’re using a deployment instead of a statefulset, then use the
k8s_deployment_name metrics to configure it.
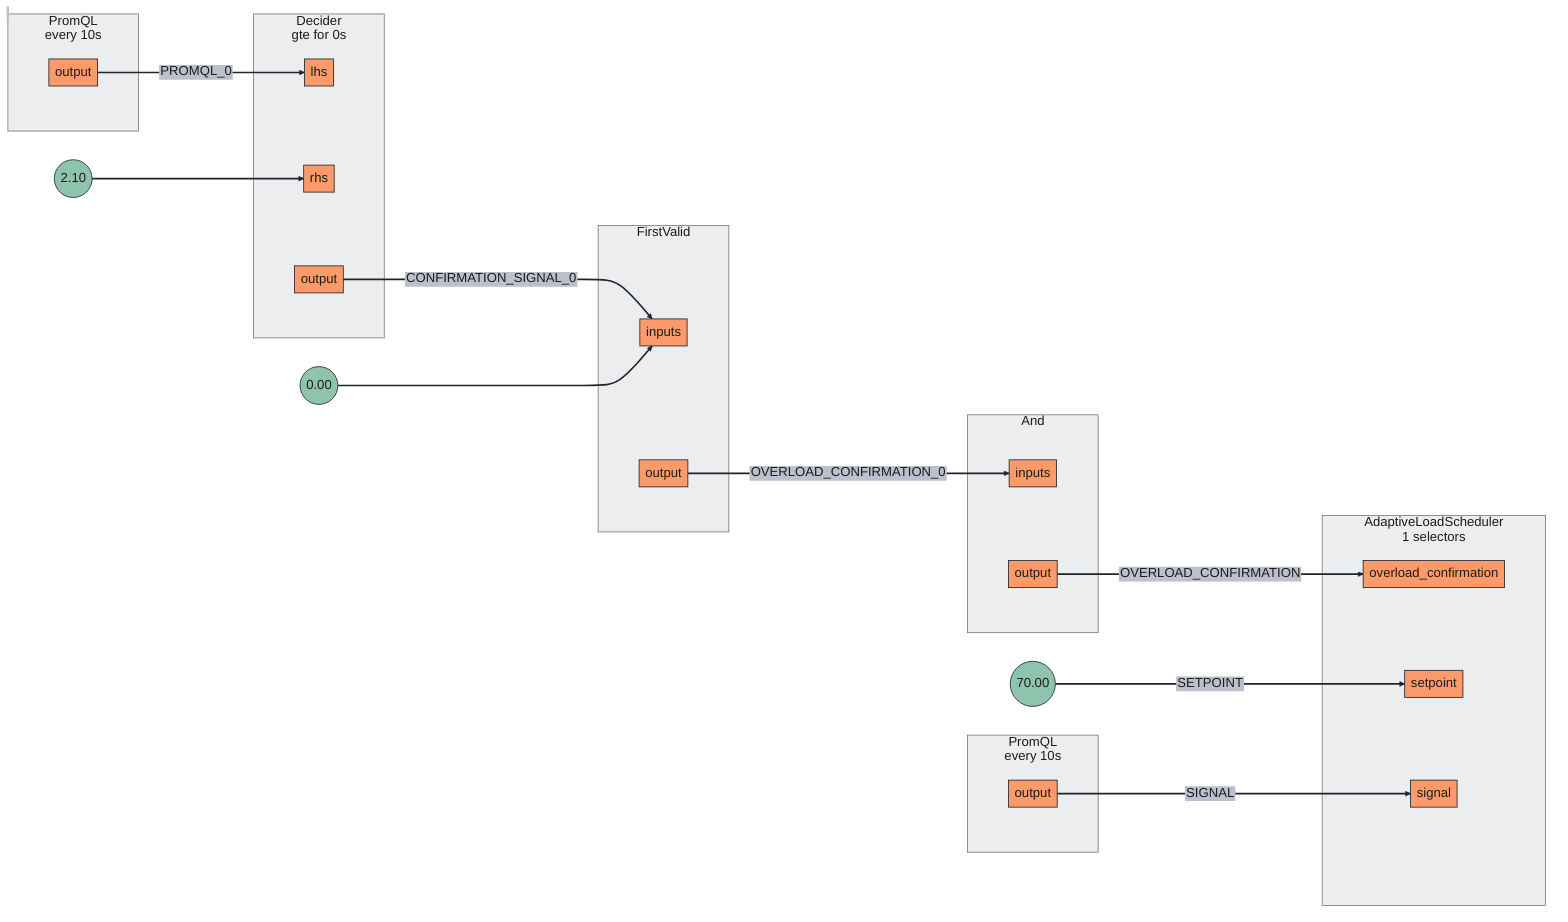
Below is the circuit diagram of how this policy will work. It is fairly
straightforward, it will use the PromQL query to evaluate the confirmatory
signal and set point which is % of max connection to enable Adaptive Load
Scheduler. Under normal conditions, all the workloads are given a fair share.
PostgreSQL Protection Policy
# yaml-language-server: $schema=../../../../../../aperture/blueprints/policies/service-protection/postgresql/gen/definitions.json
policy:
  policy_name: workload-prioritization-postgres
  setpoint: 70
  postgresql:
    endpoint: hasura-postgresql.cloud.svc.cluster.local:5432
    username: postgres
    password: DevPassword
    collection_interval: 1s
    tls:
      insecure: true
  resources:
    flow_control:
      classifiers:
        - selectors:
            - service: hasura.cloud.svc.cluster.local
              control_point: ingress
          rego:
            labels:
              source:
                telemetry: true
              operation:
                telemetry: true
            module: |
              package hasura_example
              source = input.attributes.source.source_fqdns[0]
              operation = graphql.parse_query(input.parsed_body.query).Operations[_].Operation
  service_protection_core:
    dry_run: false
    cpu_overload_confirmation:
      query_string: avg(k8s_pod_cpu_utilization_ratio{k8s_statefulset_name="hasura-postgresql"})
      threshold: 2.1
      operator: gte
    adaptive_load_scheduler:
      load_scheduler:
        selectors:
          - control_point: ingress
            service: hasura.cloud.svc.cluster.local
        scheduler:
          workloads:
            - label_matcher:
                match_labels:
                  source: "api-service.cloud.svc.cluster.local"
              parameters:
                priority: "255"
              name: "api-service"
            - label_matcher:
                match_labels:
                  source: "agent-service.cloud.svc.cluster.local"
                  operation: "mutation"
              parameters:
                priority: "100"
              name: "agent-service-mutation"
            - label_matcher:
                match_labels:
                  source: "agent-service.cloud.svc.cluster.local"
                  operation: "query"
              parameters:
                priority: "50"
              name: "agent-service-query"
When overload occurs at PostgreSQL, the policy performs adaptive load scheduling with workload prioritization while ensuring the % of max connections shouldn’t exceed 70 (the defined set point in the policy).
Workload Prioritization will ensure that the API service request is given more
priority over Agent service requests to PostgreSQL, this is achieved using label
matcher, which is defined in the policy Source.
Operation type based Workload Prioritization is also configured similarly, which
uses the label matcher Operation to decide the request priority in case of
Agent Service requests. When multiple requests come from the Agent service,
mutation requests are prioritized over query requests. Above all, the API
service gets the highest priority
One thing to note: The operation type label is extracted using a classifier defined in the policy; A Classifier is defined in the policy to extract the operation type using the Rego module.
So, the order of Prioritization follows. API Service Requests > Agent Service
Mutation Operation > Agent Service Query
Why Mutation over Query Requests?
A query operation is a read operation, while a mutation operation can write, update, or delete data. In the case of FluxNinja, mutation operations from agent services occur after a series of query operations. To prevent discarding the work already completed during the preceding queries, mutation operations are given higher priority over queries. This prioritization ensures that the effort invested in the preceding queries is not wasted.
This way, Aperture ensures how the system should react when there is a high load. All the components defined in the policy work together to provide PostgreSQL protection in overload situations while ensuring high-priority workloads are respected.
All of this is done even before the request reaches PostgreSQL or Hasura, this saves resources during overload situations.
Note: Where a policy is acting, it can be easily identified based on the control point.
Policies in Action
Hasura's policy maintains latency within the EMA boundaries. If latency deviates, it will scale Hasura to manage the influx of requests. A second policy monitors that the maximum connection usage does not surpass 70%. If it does, and CPU usage is high, Aperture initiates Adaptive Load Scheduling with Workload Prioritization, ensuring the user experience is sustained.
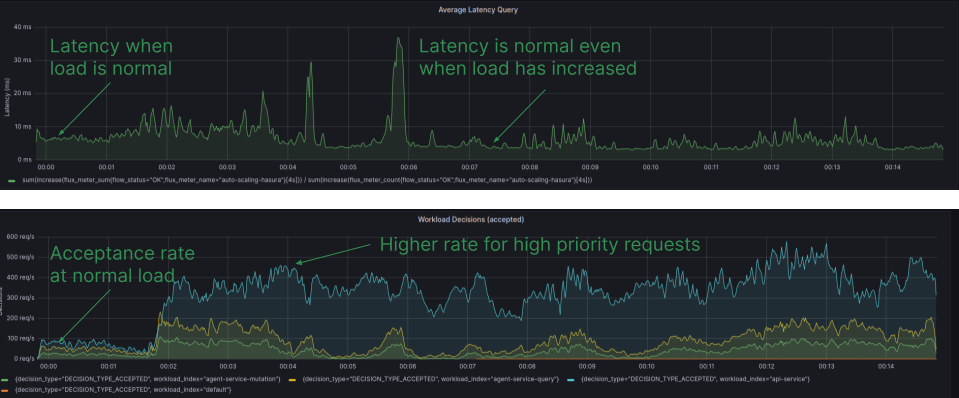
The Diagram is sourced from the Grafana Dashboard, displaying the latency and workload acceptance rate for individual workloads with Aperture policies implemented. Latency remains within the desired range, and the acceptance rate remains high, even during periods of high load.
By leveraging Aperture's capabilities and using these policies, FluxNinja achieved effective PostgreSQL protection, addressed performance issues, and ensured user experience even during sudden traffic spikes.
Challenges
- Identifying the appropriate confirmatory signal for PostgreSQL protection can
vary across different scenarios. In our case, the common one which proved
helpful was obtaining the percentage of maximum connections used and tracking
CPU usage.
- High CPU usage could indicate the execution of an expensive query or many open connections.
- Gathering both metrics, i.e., number of connections and CPU usage, clarified the situation to a considerable extent. Although these are not the most exhaustive metrics, they served our purpose adequately.
- Determining the right metrics is a task, especially when these metrics are being used as signals in the policy. For us, the situation was streamlined with the use of telemetry collectors, which gathered all the required metrics. However, for more advanced scenarios, for example, determining which query is expensive or time-consuming, additional thought and planning might be required on how to acquire these details.
Conclusion
Aperture operates within the FluxNinja infrastructure, safeguarding it against sudden spikes and overload scenarios. Although it currently focuses on protecting PostgreSQL, there are certainly more opportunities for us in the future to address other issues with it. The effectiveness of Aperture has been evident in our work on the product designed for the next generation of Reliability Teams.
During the process of writing this blog and researching various postmortems and reports, it has become apparent that companies need a solution like Aperture. These insights underline the importance of Aperture in confronting the issues highlighted in many organizational blogs.
We invite you to sign up for Aperture Cloud, offering Aperture as a service with robust traffic analytics, alerts, and policy management. To learn more about Aperture, please visit our GitHub repository. You can also join our vibrant Discord community to discuss best practices, ask questions, and engage in insightful discussions with like-minded individuals.
For further reading on PostgreSQL protection and related topics, we recommend exploring the following resources:
- Aperture Documentation: Dive deeper into the features and capabilities of Aperture for effective load management and protection.
- Postmortem: RDS Clogs & Cache-Refresh Crash Loops | Honeycomb
- Addressing GitHub’s recent availability issues
- Performance isolation in a multi-tenant database environment
- Mastering Chaos: Achieving Fault Tolerance with Observability-Driven Prioritized Load Shedding